Today I learned once more, that:
It is much easier to describe a certain object with an image (e.g. the Great Chinese Wall below) than using a lot of words. You know the old saying, a picture says more than 1000 words.

The Great Chinese Wall north of Beijing. Photo taken on April 15, 2005.
But there is also another way to be used and which saves a lot of space, needing only a couple of bytes instead of thousands or millions of bytes. I am talking about an INDEX. So what is an index and what can we do with it?
An index is an indirect shortcut derived from and pointing into a greater volume of values, data, information or knowledge. It is used in many contexts, e.g. business, publishing, sciences, technologies. If you have invested some money in the stock market, especially in a fund which closely follows the evolution of the market, then probably the stock market index is something that attracts your attention every business day. And if you are an optical physicist, then the refractive index is as dear to you as anything in your life. But I would like to describe two other totally different indices, starting with the
Purchasing Manager’s Index (PMI). This index is compiled by two different private organizations, one that covers 30 countries in the world, and the other one only the USA. But what they have in common is that they describe how the market in private sectors have changed since the last publication of the index, and are often cited in business newsmedia. The formula for the PMI is PMI = (P1 x 1) + (P2 x 0,5) + (P3 x 0), where P1 is the percentage of people who report a status improvement, P2 the percentage of answers considering no change, and P3 the percentage of all answers reporting a status deterioration.
This means that the PMI can show any value between 0 % and 100 %, where the lowest value would happen if all reports are showing deterioration and the highest value would only occur if all reports are indicating improvement. In practice, the index is most of the time close to 50 %, and the business analysts use it to comment on variations in fractions of percent units. A good example of how the PMI is presented and analyzed by the press can be seen in reference 2. It shows that right now the Swedish manufacturing industry is doing very well, with a PMI of 55,5 % , although it slowed down from 56 % the month before. China continues to be a problem, where the PMI in January, 2016, was 49,3 % as compared to 49,7 % in December, 2015.
Another way of implementing an index was introduced by the US company KIC in 2002. KIC develops and markets equipment to measure and track the process of soldering electronic printed boards. Their Process Window Index (PWI) offers an elegant way to quantify the robustness of a production process. In reference 3 is the original article which presented the PWI concept.
In practice, KIC uses PWI mostly when quantifying the robustness of this reflow soldering process, where a solder paste melts and after having been liquid during a minute or so, gradually the temperature is lowered until it finally reaches ambient temperature. There are four interesting parameters in this process: 1) slope, the rate of temperature rise from ambient to a first plateu temperature; 2) soak, how long the solder paste can sit in that plateau temperature to prepare the chemistry components for the soldering; 3) peak temperature; 4) time in liquid state. Each of these four parameters have a range in values: minimum, maximum and typical value. If the actual measurement is exactly typical value, then the grade for that parameter is 0, minimum value represents –100 % and maximum value is +100 %.
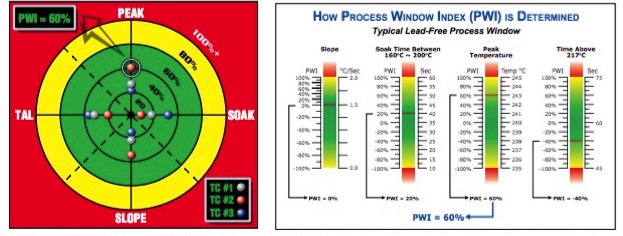
Two different interpretations about how PWI is determined for a reflow soldering process. Copyright KIC
So, we measure those parameters during the reflow soldering process of an electronic board and attribute a value to each one of those four. One example could be: 1) slope, 0 %; 2) soak, 20 %; 3) peak, 60 %; and 4) time above liquiduos, -40 %. We then take the absolute value, 1) 0 %; 2) 20 %; 3) 60 %; and 4) 40 %, and attribute the highest of those values, 60 % in this case, to PWI for the process in this particular measurement. See also reference 4 below.
… That’s what I learned in school!
2: Inköpschefsidex sjönk i januari jämfört med december
3: PWI: Process Optimization Made Simple
